Medication Cycles Tracker
2025Browser-based pharmacokinetic tracker for Venvanse (ADHD medication). A 3D parametric helix spiral visualizes the 15-hour medication cycle across 5 phases, with dual concentration models (linear and exponential half-life), system notifications at phase transitions, and task recommendations based on energy level.
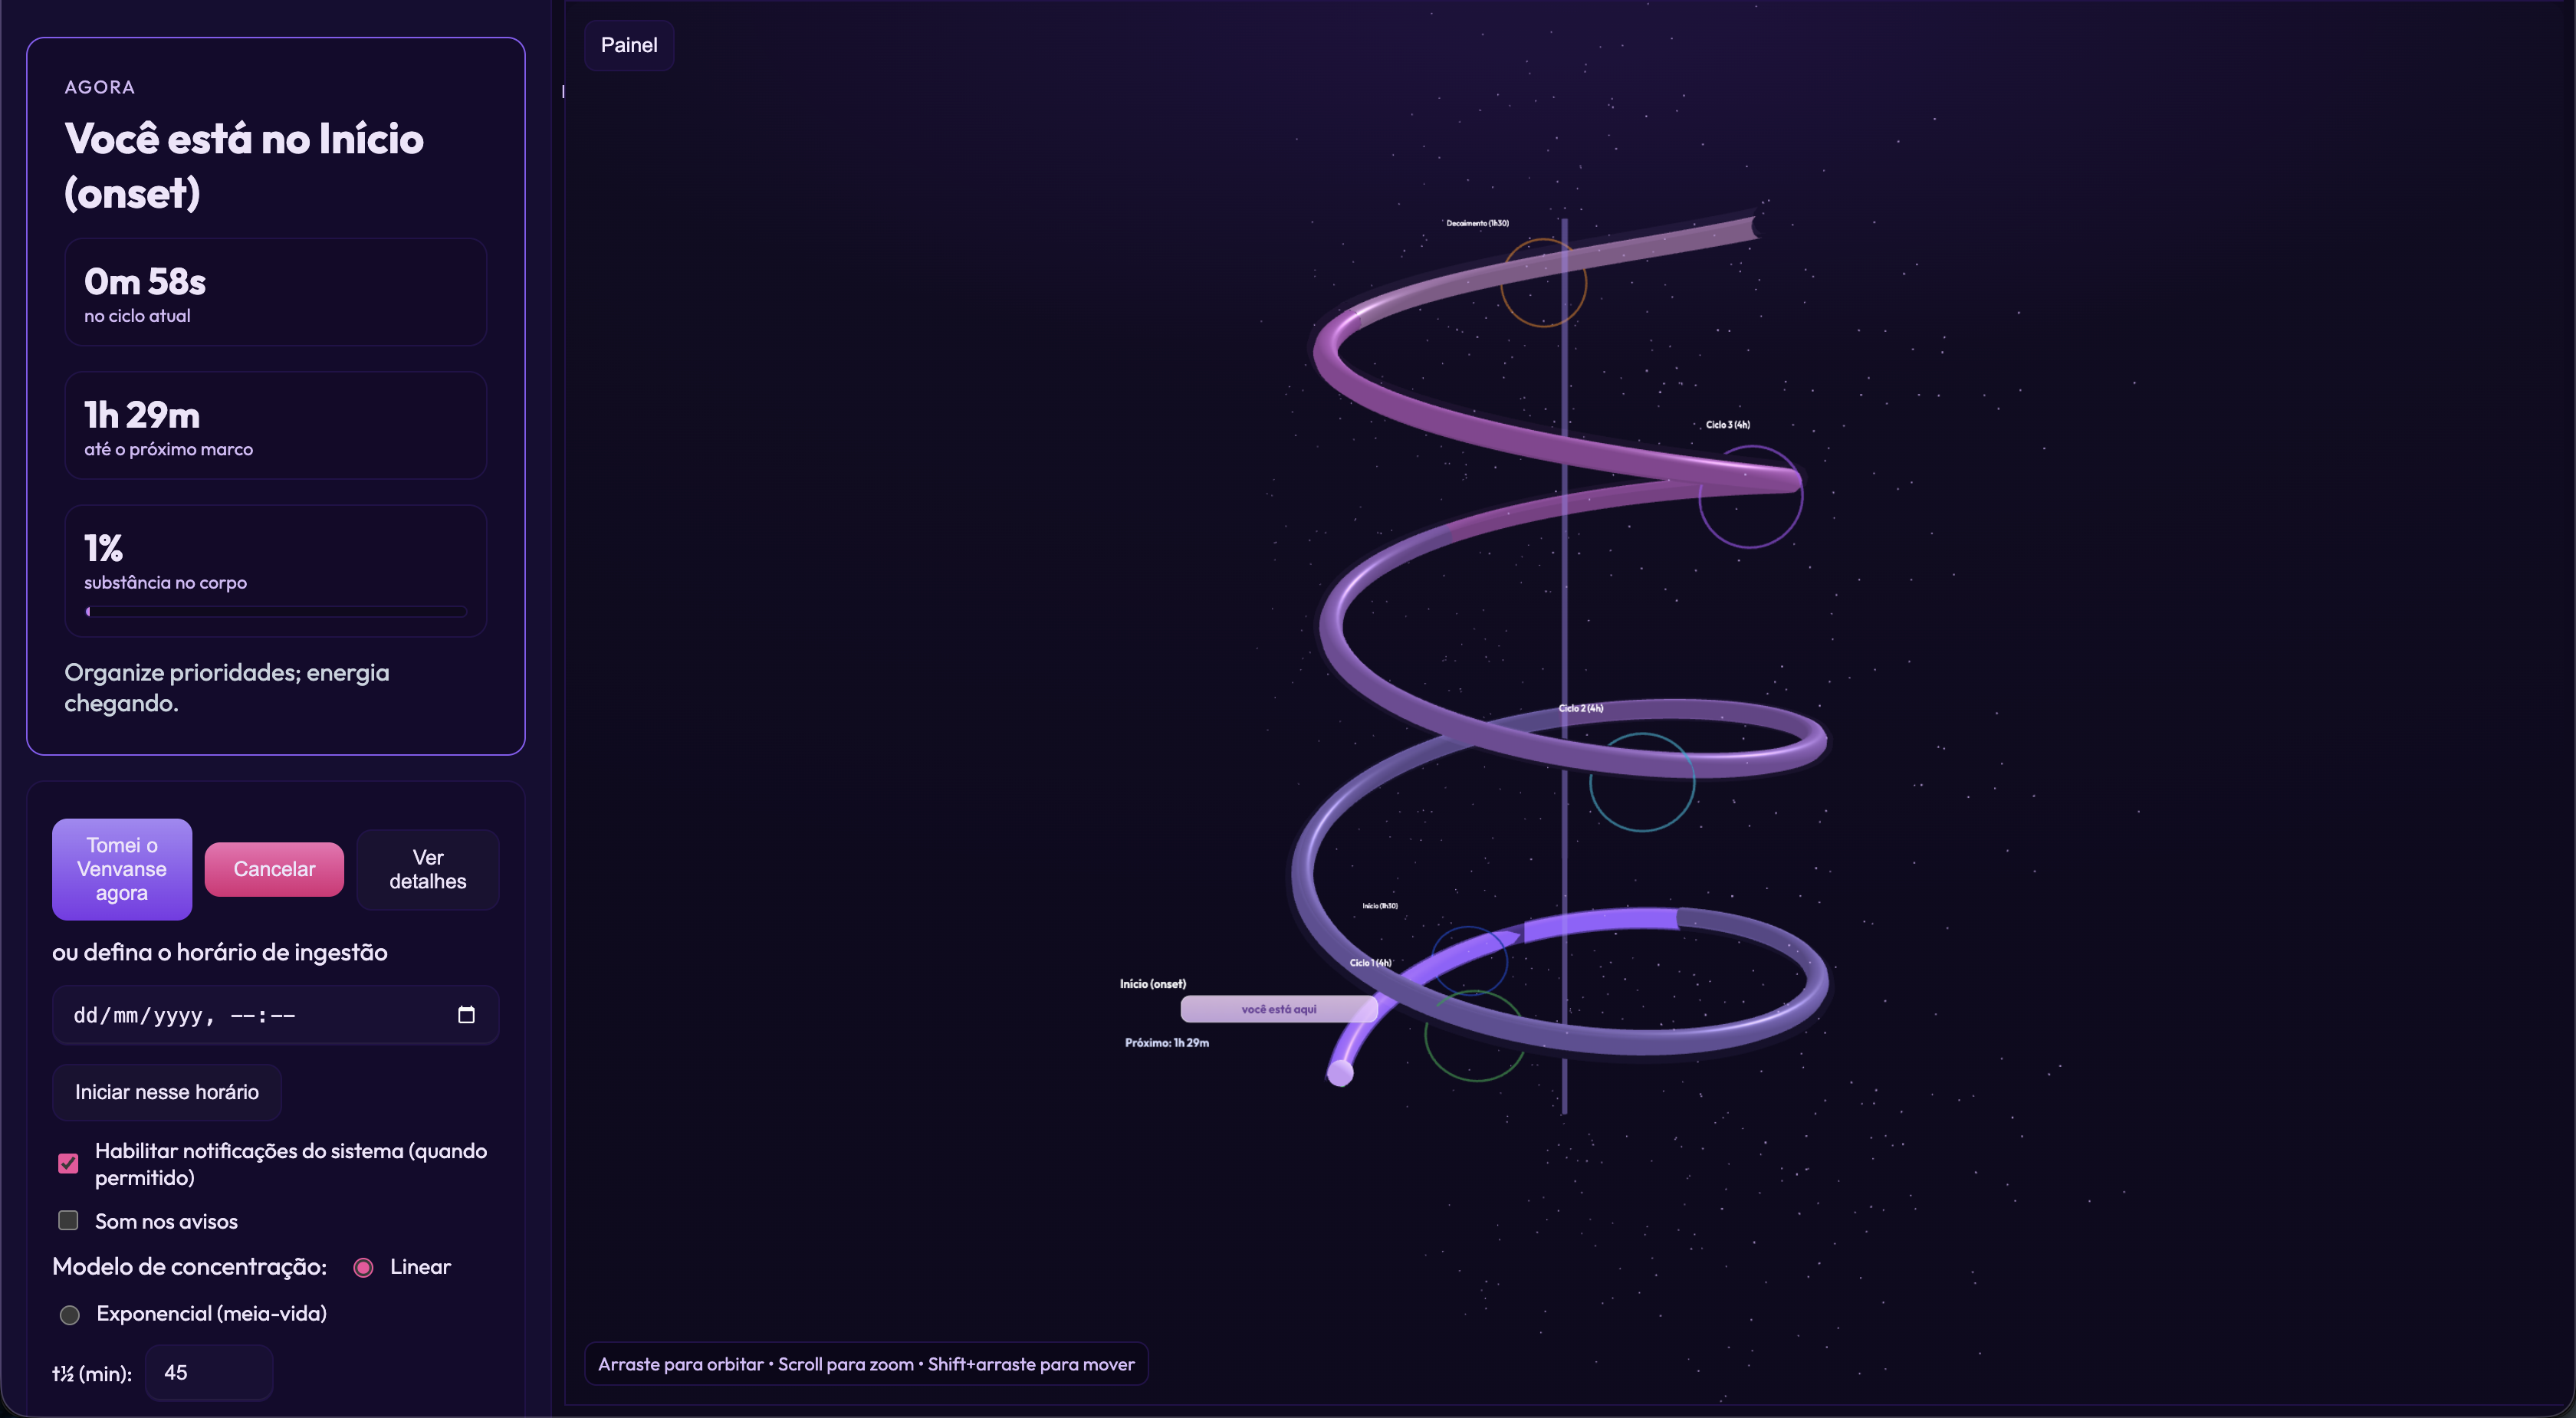
Medication Cycles Tracker is a 3D pharmacokinetic visualizer that makes the invisible visible: it maps the 15-hour effect cycle of Venvanse (a stimulant ADHD medication) onto an interactive 3D helix, with the user's current position shown in real time as a glowing marker on the spiral. The five phases (onset, peak cycle 1–3, decay) are color-coded segments on the helix. Users start a cycle when they take their medication; the app calculates concentration percentage, suggests appropriate task types per phase, and sends system notifications at phase transitions.
ADHD medication users often struggle to align demanding cognitive tasks with peak medication efficacy — they either start important work too early (medication not yet active) or too late (already in decay). Existing medication tracking apps show only timers and reminders; none visualize the pharmacokinetic curve or provide phase-aware task guidance. The challenge was to make pharmacokinetic data intuitive and actionable through spatial 3D metaphor.
Build a browser-based pharmacokinetic visualizer that: (1) represents the 15-hour medication cycle as a navigable 3D helix; (2) shows the user's real-time position on the spiral; (3) computes concentration using two mathematical models; (4) sends system notifications at phase transitions; (5) runs as a zero-dependency vanilla JS app.
- ◈Solo developer — 3D visualization, pharmacokinetic modeling, UI, notifications
- 01Parametric helix over a 2D progress ring — a 3D spiral allows the user to zoom in on their current phase, zoom out to see the full 15-hour arc, and orbit the visualization for spatial context. The helix metaphor maps to time naturally (the spiral 'unwraps' into a timeline). A progress ring would show position but not the pharmacokinetic shape of each phase.
- 02Custom THREE.Curve subclass for helix geometry — extending THREE.Curve allows TubeGeometry to sample the curve at arbitrary resolution. The getPoint(t) method adds subtle radius oscillation (r = radius × (0.9 + 0.1 × sin(t × 2π))) that makes the spiral feel organic rather than mechanical. Crucially, the curve can be sampled at any t for the progress marker position without re-computing the full geometry.
- 03Canvas sprites for dynamic text — all labels (phase name, countdown, 'you are here' pill) are rendered to HTML Canvas elements, converted to THREE.CanvasTexture, and displayed as THREE.Sprites. This avoids loading a font loader or text geometry library; text updates only require canvas redraw + texture.needsUpdate=true, not geometry recreation.
- 04Dual concentration models (linear vs. exponential half-life) — the linear model (concPct = elapsed/duration × 100) is intuitive for quick estimation. The exponential model (logistic sigmoid for onset, exponential decay with configurable half-life for decline) matches the pharmacological reality of Venvanse XR's extended-release mechanism. Users can toggle between them and configure the half-life parameter.
- 05CSS variable for panel/canvas layout — the collapsible side panel uses a single --panel-left CSS custom property to animate both the panel position and the canvas offset. Toggling the panel updates one variable; both elements transition together. After the panel animation completes, a resize event forces WebGL to update the renderer dimensions.
- 06Heartbeat pulsation using a double-peaked sinusoid — the active segment's emissive intensity follows: base + exp(-((r-0.12)/0.06)²) + 0.6×exp(-((r-0.34)/0.07)²), where r = (time mod 1.8s) / 1.8. The two Gaussian peaks create a physiologically accurate double-beat pattern that makes the active phase feel alive without being distracting.
- →3D metaphor adds meaning when the geometry encodes the data — the helix is not decorative. Its spatial structure (longer segments = longer phases, marker position = elapsed time) means users can read pharmacokinetic state spatially without reading numbers. The metaphor earns its complexity.
- →Parametric curves enable marker-on-curve positioning without extra data structures — given a t value (elapsed/total), the curve's getPoint(t) returns the exact 3D world position for the marker. No lookup table or interpolation needed; the math is the data structure.
- →Zero-dependency vanilla JS is a valid production target for single-purpose tools — the app has no npm, no bundler, no framework. This made iterating on 3D geometry and pharmacokinetic math extremely fast: save, reload, see. For a personal health tool used by one person, the simplicity tradeoff is clearly correct.
- →System notifications require careful deduplication — early versions sent duplicate notifications when the user reloaded the page near a phase boundary. Comparing g.at - now > 0 before scheduling each notification (rather than scheduling all on page load) eliminated duplicates without requiring persistent notification state.
Live — deployed to GitHub Pages